How to Improve Process Run Time with Process Execution Performance Monitoring
 Jana_OWC
Moderator, Member, KB ContributorPosts:14
 Contributor II
Hello everyone,
Using the process execution performance monitoring feature is easy:

Please note that run time can vary over different executions as RapidMiner might free up memory in the background, temporarily suspending process execution. So it’s advisable to run it a few times to confirm if an unexpected long run time of an operator is indeed caused by the process logic itself.
today, for my weekly Knowledge Base article, I'd like to present a nifty little feature of Old World Computing's Jackhammer Extension: Process Execution Performance Monitoring.
Basically, this feature gives you a run time analysis broken down into how long each individual operator takes to complete its task, for a single run as well as for all runs if executed in a loop. This enables you to see which operators are potentially slowing down process execution, how your process might be optimized in terms of run time, and finally lets you see what effects changes in your process design have.
This is extremely useful in scenarios where run time matters, like deployment of web services usingRapidMiner ServerorReal Time Scoring Agent. Especially when building a web application using RapidMiner Server, run time becomes crucial: Whenever your process takes longer than half a second, the users' patience is tested.
Once you have identified the important bottle necks in your process, you might be able to resolve it by insertingCacheoperators, speed up database queries or redesign parts of your process.
哟u can find the Jackhammer Extension in theMarketplace.
Step 1
Open an existing process in RapidMiner or design a new one. For this example, we have simply used one of the sample processes that come with RapidMiner. On the menu, click on “Process”.
Step 2
With the Jackhammer Extension installed, the menu will show “Enable Process Execution Performance monitoring”. Enable it.
Step 3
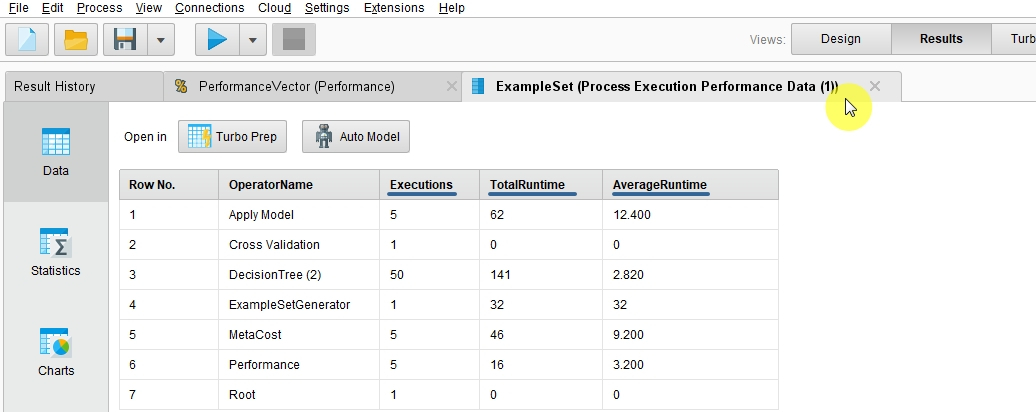
Now, run your process. In the Results window, you will now get an additional tab labeled “ExampleSet (Process Execution Performance Data). Select it to have a look at the data.

As you can see, the example set contains a row for each operator that has been executed, how many executions there were, the total run time per operator as well as the average run time per operator per execution, in milliseconds. This gives you the opportunity to see where you might want to tweak your process to speed up run time or see how changes you made affected process run time.
7


